2019 was another big year on the Black Hops content front, with the website attracting a lot of hits throughout the year off the back of a bunch of Blog Post updates, as well as the return of the Podcast with the launch of Season 3 and lots of growth on social media.
Here is a bit of a summary for how things went in 2019.
Overall website stats

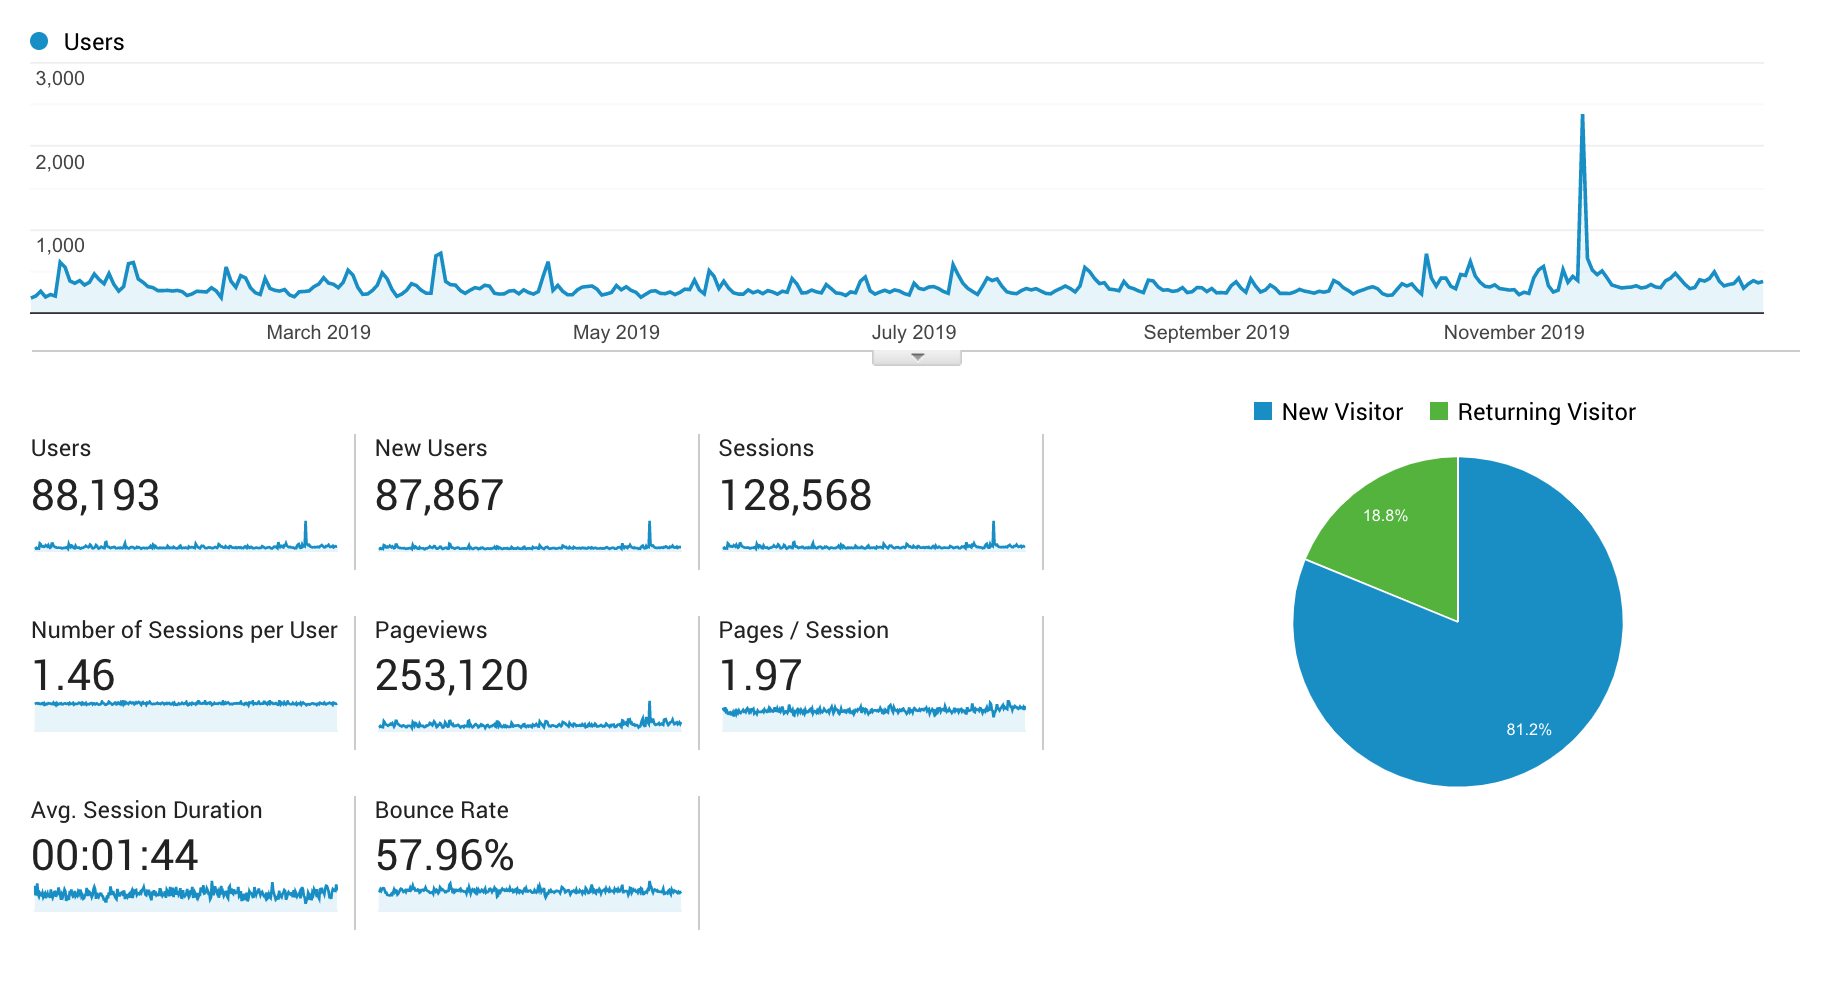
The total number of website visits for the year was 128,568, which equates to 10,714 website visits per month, or around 352 hits per day.
Here are some more interesting breakdowns:
- Four out of five people hitting the website were new visitors according to Google Analytics (not super accurate).
- The average amount of time spent by a website visitor: 1:44 minutes.
- The average number of pages visited per session: 2.
- Total number of pages viewed: 253,120.
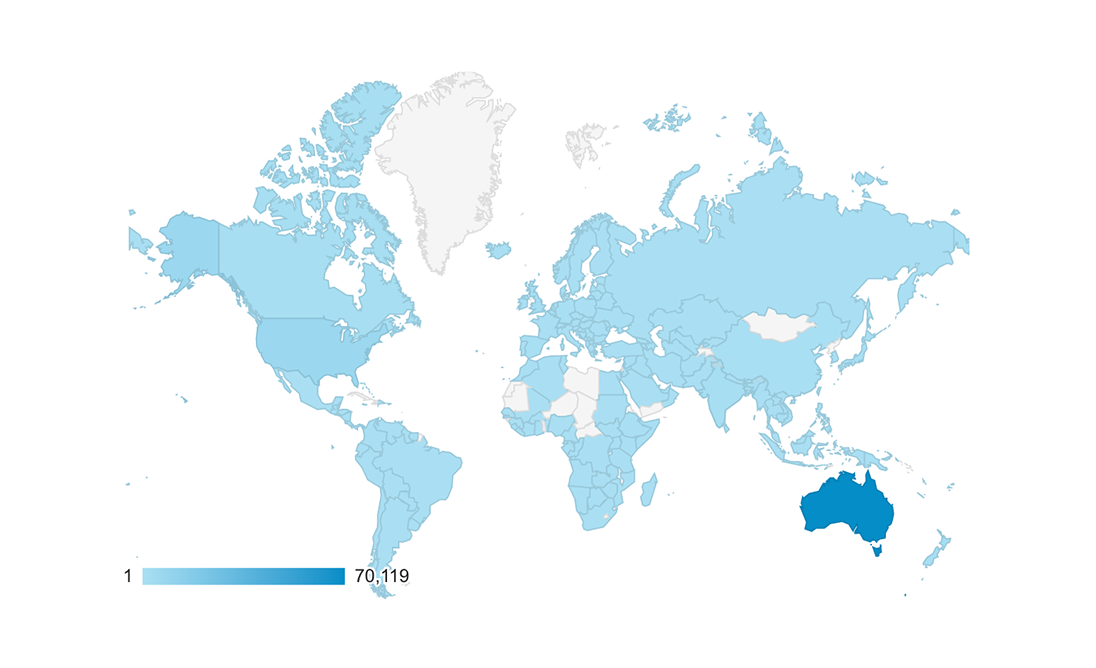
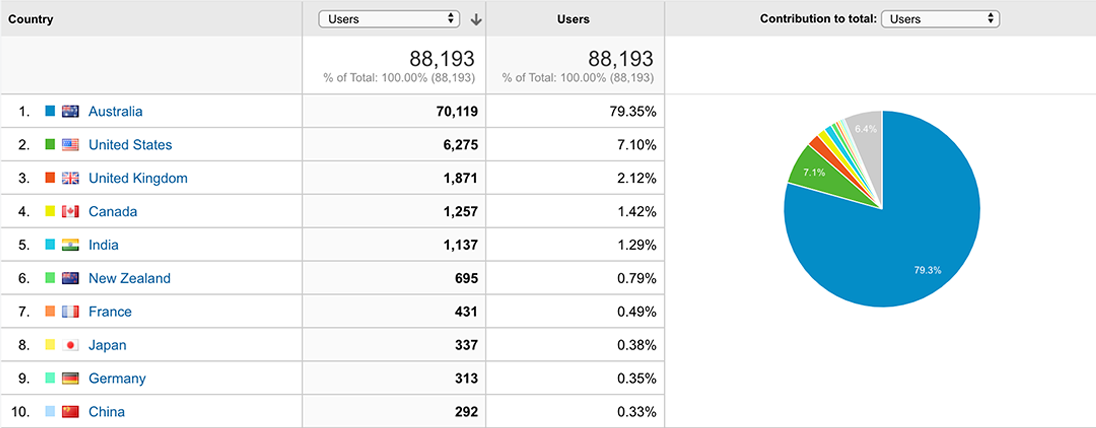
Overall these states have grown consistently since we launched the blog, but it is harder and harder these days to get people away from social media channels and onto the website. Our social media accounts have grown a lot more than the website in the same period. As you can see from the map below, our visits are mostly from Australia but we do get traffic from around the world, particularly the U.S.


There’s also been a consistently high percentage of people viewing the site on a mobile. Towards the end of this year we changed servers and halved the site speed, which helped a lot with people viewing the site on mobile.

What Went Well On The Blog in 2019?
It was another solid year on the Black Hops blog. We are now up to 137 blog posts in total, about the same amount of unique beers we’ve created! 44 of those posts were this year however that includes 12 posts for hiring staff and 8 new podcast episodes so only 24 proper articles.
Here are the top posts by views for 2019, with the views listed.
- Food Safety Recall: Black Hops Extra Eggnog (3032)
- Canning and Packaging Our Beers How We Do It (1,332)
- Black Hops Launching a Brewery in Biggera Waters (1,303 views)
- What Exactly Is Equity Crowdfunding? (1,093 views)
- Equity Crowdfunding a Brewery In Australia (951 views)
- Black Hops Moving to 16 packs (601 views)
- Sour Beers & How We Brew Them (509 views)
Here are some other in depth articles worth a look that didn’t make the most visited list.
- Designing The BHII Taproom
- How We Brew Low Gluten Beers
- How To Create A Beer Sensory Program
- Things To Watch Out For When Canning Beer
If there are ever any content ideas you’d like to see us cover on the blog, just let us know via our Facebook Ambassadors group and we’ll do our best to put something together.
Season 3 of the Operation Brewery Podcast

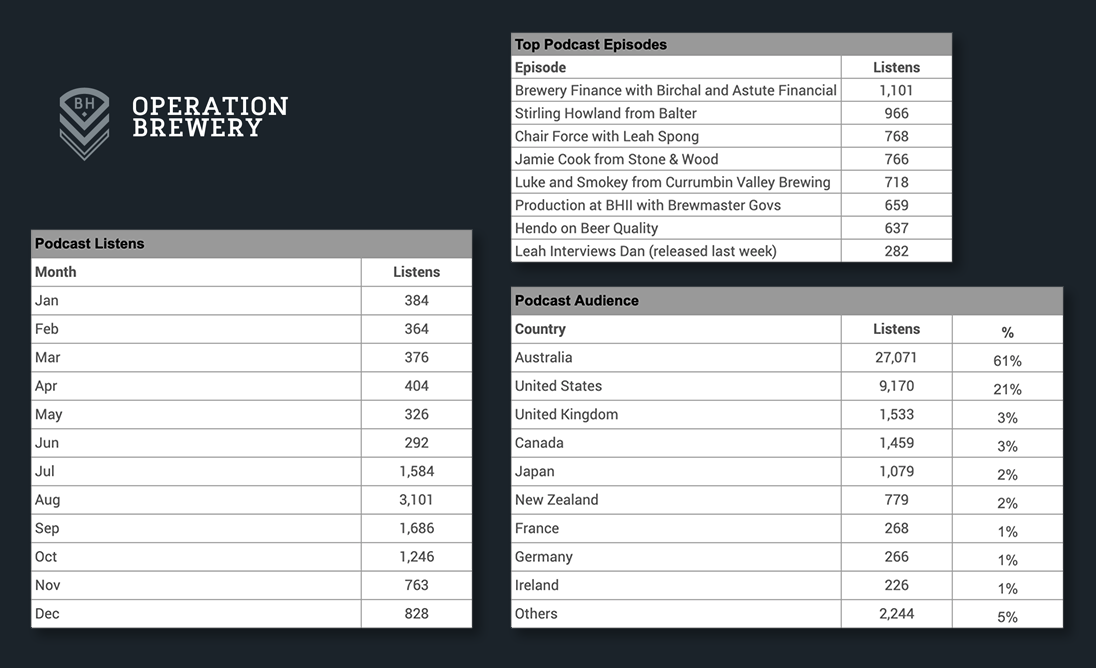
In addition to written content, this year we brought back the Operation Brewery podcast and launched 8 new episodes in season 3. Here’s the list of episodes in order of most views to least. All episodes are also available in the Apple Podcasts app and Spotify. The ones that have been out the longest will tend to have more views.
- Brewery Finance with Birchal and Astute Financial (1,101 listens)
- Stirling Howland from Balter (966 listens)
- Chair Force with Leah Spong (768 listens)
- Jamie Cook from Stone & Wood (766 listens)
- Luke and Smokey from Currumbin Valley Brewing (718 listens)
- Brewery Equipment at BHII with Brewmaster Govs (659 listens)
- Hendo on Beer Quality (637 listens)
- Leah Interviews Dan (released last week) (282 listens)
All up the podcast has now got 44,201 listens since launching it in 2015. Not a huge audience, but enough to make it worthwhile. It’s also interesting to see in the overall stats above that almost 20% of the audience is from the U.S.
Social media Snapshot

As we mentioned, while the website growth has been there, most growth has been via social media. Here are our current stats with the growth for the year:
- Instagram Followers: 21,000 up 61% from 13,000.
- #blackhops hashtag posts on Instagram: 5,000 up 25% from 4,000.
- Facebook likes: 9,492 up 35% from 7,000.
- Facebook Ambassador Group Members: 1,740 up 74% from 1,000.
We also recently launched our second Instagram account @blackhopstaprooms which now has 516 followers.
Overall it’s been another fun year putting out content via our blog, podcast and social channels. If you have any content ideas you’d like us to cover, just hit us up in the Facebook Ambassador Group and we’ll do our best to cover it.