Our book Operation Brewery details all of our various decisions before starting Black Hops. A lot has changed since we started and we’ve learned many valuable lessons. In this post I’ll go through 11 of the most important lessons we’ve learned in the last 6 years.
We started with a home brew in 2014 and eventually our own small $400k brewery in 2016 in Burleigh Heads (HQ). That brewery was capable of about 200,000L / year but we increased that to around 400,000L per year with a bit of an upgrade to an adjacent site. As we approached that volume, we built a new one that would ultimately allow us to produce multiple millions of litres of beer annually.
This post was written in July 2020, we are doing around 1,500,000L per year currently across 2 sites. This puts us ‘just’ on the other side of the brewery valley of death. The unprofitable void between a small brewery and taproom and a larger scale craft beer brand. At the end of this post, I’ll add some thoughts on the brewery valley of death.
1. Beer is Expensive
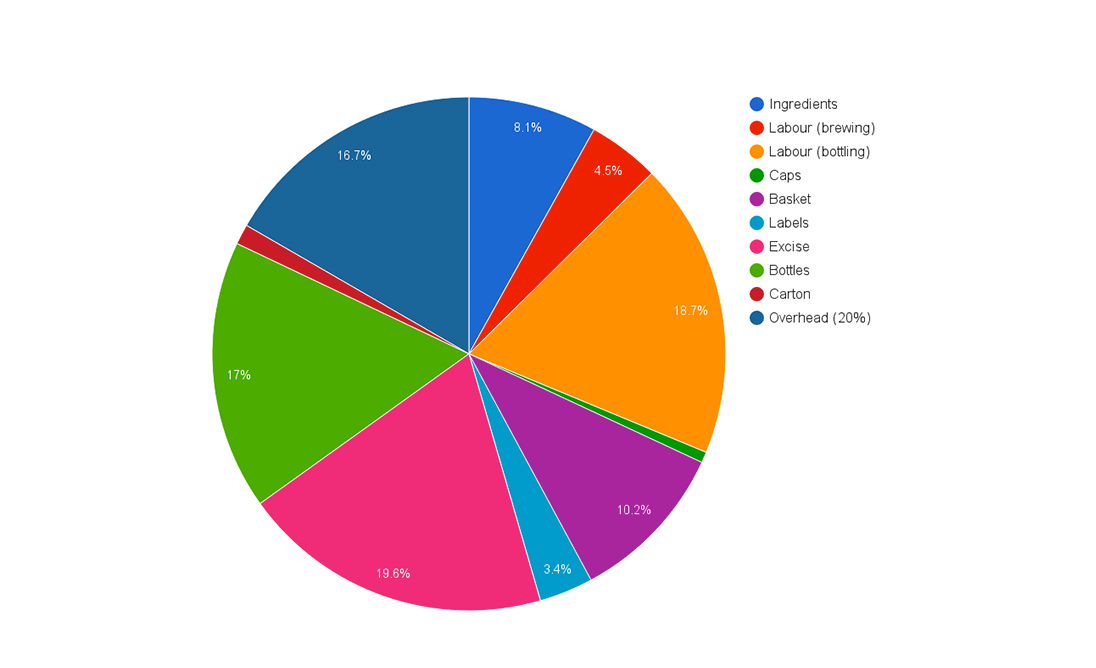
Even 6 years after doing our first commercial batch, we are still improving on our ability to work out exactly how much beer costs to make. But we know one thing. It’s a lot. Knowing these numbers as well as possible is critical and the numbers change so wildly for different beers that we make sure we do batch costings for every single beer we make.
Knowing the exact cost means for smaller releases we can release them with a decent profit at the taprooms. It also means that when customers want to negotiate prices we have some idea of where we are at and whether we have any room to move. Things like the batch size and fully custom-designed full wrap labels can make certain beers super expensive. For example a big batch of our core range Pale Ale costs around $40 for a 16 pack carton. But a small batch beer like our 9.7% Cream Cloud, comes in at well over twice as much at $94. If you know these numbers, you can make informed decisions about where to allocate this effort and how much to charge for the product.
Knowing your numbers doesn’t necessarily mean you can make lots of profit on every sale, you still have the realities of competition to factor in. But you can make more informed decisions about where you want to compete. And if you are trying to build an expanding wholesale brand like we are, it can help with explaining the story to your investors around how you are going to make it happen.
As the overall scale and volume goes up, the beers are significantly cheaper to make. Knowing how those numbers look at various levels of scale is really important to pricing. Our approach was to start selling mainly at the taproom and gradually branch out into kegs (better margins than packaged beer), before getting into bulk packaged beer sales. If we’d done packaged beer like we do now at the start, it would have been very difficult, because of how low the margins are and how much scale is needed to make the exercise profitable.
Dig into this topic further: Craft beer prices: how much does beer cost to make? 2.0.
2. Brand is Critical
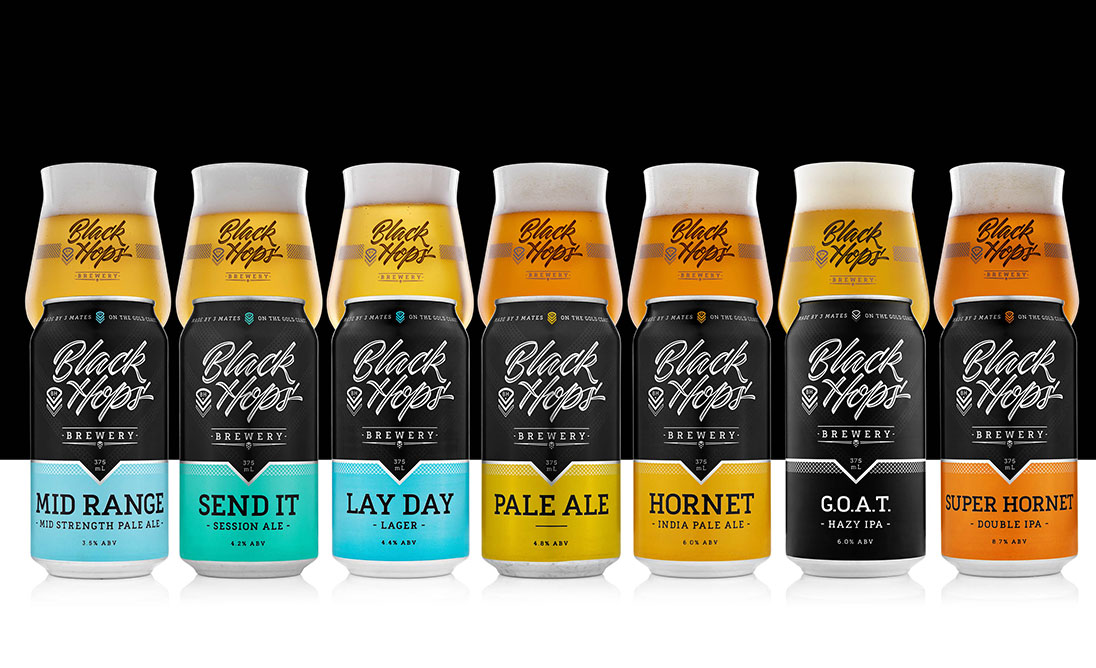
Brand is something we’ve always valued very highly at Black Hops and for good reason. People fall in love with brands, and the value of the product and the company are tied closely to the value of the brand. If you want to sell beer for a decent price, you need a brand that people love. And if you want to build a business that people want to invest in at a decent valuation or potentially a business you want to sell one day, the brand value will drive how much it’s worth. I’ve seen breweries doing reasonable volumes selling for not much more than the cost of the equipment. Then I’ve seen others who aren’t profitable, worth 6-10X their annual revenue, mainly because they have extremely strong brands.
Building a brand is hard. Having a great name and a great design that stands out in packed craft beer taps and fridges is a huge challenge. Then keeping the brand consistent across various channels is really hard. If you aren’t a designer, it’s also super expensive and high-risk every time you engage a designer for a project. On top of that, having a brand that stands for something or means something is critical, and also not easy.
We focus as heavily as we can on our brand and we spend a lot of time with designers designing our cans, boxes, labels, sales activations and more. We will often get completely custom designs and professional photos done for tiny batch beers that sell out in minutes. We have loads of designers we work with and a lot of processes around ensuring a great design for our beers. It takes a lot of time, costs a fair bit of money, but ultimately it has a huge impact on the sales and our marketing attention for the beer releases, and the way the brand is seen as a whole.
This is something we never stop thinking about.
Dig into this topic further: We’ve written about this quite a bit up on the blog, check out the brand section for a few articles and podcasts on the topic.
3. Track Progress Regularly
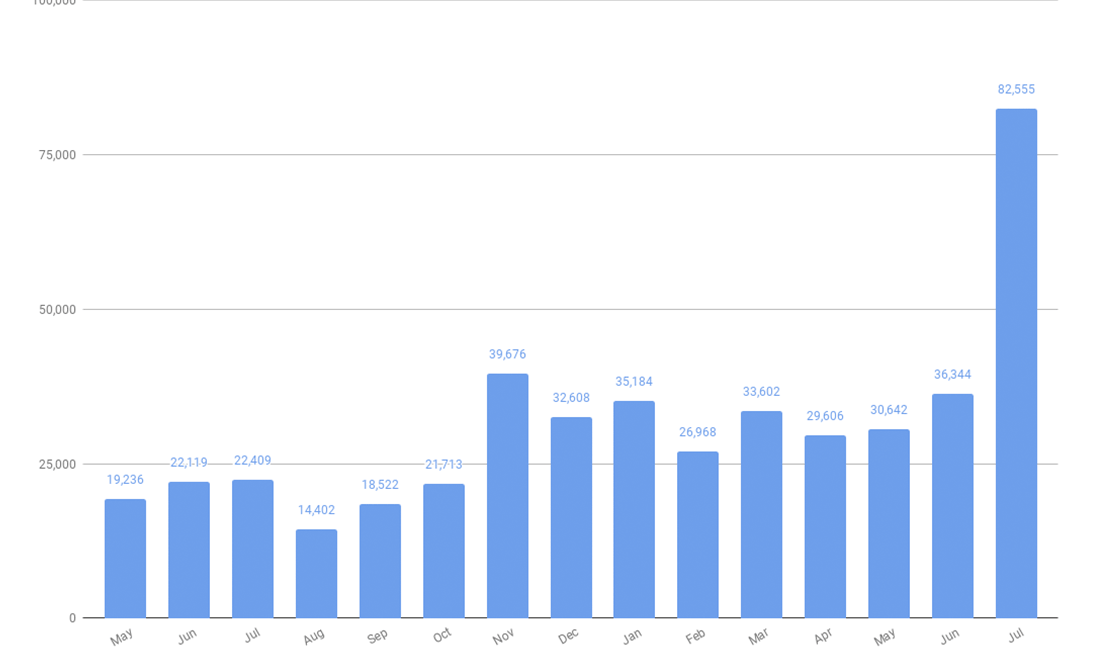
Running an independent brewery, you are always on a knife’s edge. Small mistakes can throw you off course significantly and they are hard to see coming.
We are pretty fanatical about keeping a close eye on everything that’s going on here. We have reports for pretty much everything you can think of.
Most of our reports are put together manually in Google Sheets bringing in data from various places. Here is a summary of the reports that I get:
Weekly
Every week I get the following reports:
- Taproom report – Looks at revenue against targets and the breakup of onsite, takeaway sales and merch etc. This is shared with the Taproom managers and the founders.
- Sales report – The sales report is one of our most in depth reports, the weekly one shows me revenues for each rep and distributor vs the weekly target, overall monthly revenue progress vs target, weekly revenue plotted against the previous 36 weeks to see trends, total keg sales throughout the week and cumulative keg sales for the month, keg revenue as a percentage of total revenue, total site visits for reps vs targets, new business won, % of customers visited, top customers and their revenue totals, names of any new customers.
- Online store report – Shows our online store revenue against previous weeks and revenue broken down by beer, merch and home brew kits.
- Founder report – The founder report includes a few bits and pieces not covered in the other reports such as what % we sold vs produced, the weekly total of stock out and what our overdue invoices look like.
Monthly
The monthly reports are a lot more detailed, they include:
- Production report – This shows number of kegs on hand, production staff costs vs budget, keg cost trend line, number of weeks worth of stock we have for core range beers and any beers that were out of stock, volume brewed in litres and that number annualised (multiplied by 12), and the total year to date volume, and that again for litres packed (different to litres brewed), number of new recipe brews, number of limited release beers released, total batch loss as a % vs target, yeast costs in a line chart, average batch turnaround time in days on a line chart, volume sold vs packed and brewed, amount brewed as a % of total capacity, replaced beer dollar value and as a % of wholesale net revenue, number of dumped batches, number of quality issues raised on a line chart over time, number of safety incidents reported and any safety changes made during the month.
- Taproom report – This shows taproom revenue on a line chart over time and HQ vs BHII taprooms, revenue breakdown of on premise sales vs takeaway vs merch per taproom and combined, and the number of new loyalty members.
- Sales report – This is our biggest report obviously with wholesale sales representing the biggest part of our business. The monthly sales report covers all reps and distributors sales revenue vs target, local revenue vs interstate as a % of all revenue and against a target, keg revenue vs pack as a % of all revenue and against a target, independent sales as a % of total retail revenue vs target, core 6 revenue vs target, overall monthly revenue against previous 24 months, overall revenue vs target, top 10 customers and their revenue shown on a line chart, total rep activities, average site visits vs target, new business won, expenditure of sales staff on samples, total keg sales, total venues on tap on a line chart over time, total on premise venues selling cans on a line chart over time, average weekly keg sales for key customers, sales by keg product on a line chart over time, top customers, number of top tier retail customers on a line chart over time,% of customers visited on a line chart over time, total number of bottle shops stocking on a line chart over time, ranging of each core 6 bers on a line chart over time, retail level of activation on a line chart over time, top retail customers, total monthly sales by product, a line chart showing how long it took us to sell out our limited release for the month vs previous months, total number of active customers and the $ total of beer returned because of best before date.
- Online sales report – The online sales report is one of the smaller ones. It contains online store revenue for the month vs previous months and broken down into beer, merch and home brew kits and average spend and total number of orders this month vs previous months.
- Founder report – Again the Founder report contains a few charts that aren’t included in the other reports including total stock value, financial position with cash on hand etc, staff costs as a % of gross revenue vs target, leave balances for all staff, a metric for the % of overdue invoices owing to us, and a table on staff benefits and sales samples.
- Marketing report – The marketing report includes the following: Instagram – number of posts, the most likes on an image and what that image was and our total followers on a line chart over time. It also includes the same info for Facebook as well as page views and reach and post engagements tracked in a bar chart over time. We track the number of people in our Facebook Ambassador Group and the total comments and reactions in the group in a line chart over time as well as total posts in the group and the most liked post for the month. It includes our website traffic in a bar chart vs previous months, the total sessions on just our Blog (as opposed to our store or homepage etc) and we have charts for email marketing including the total list size, the open rate and link clicks. We don’t do a lot of video, but we also have a section for videos releases and total views. We also include a chart that tells us how quickly we sell out of beers at the taproom and the quantity of cartons sold on launch day. We see it as a marketing challenge to make sure we have the right demand for limited release beers. We have charts for podcast downloads and Supply Drop App downloads, and finally we have yearly charts in there just as a reminder for major events on the marketing calendar including our position in the Beer Cartel Craft Beer Survey and GABS Hottest 100.
- P&L and CFO Report – Each month once our accounting is complete, we have an external service that provides me and our in house bookkeeper a detailed ‘CFO Report’. It includes the normal P&L but it also includes a lot more useful info and commentary from the accountant. The report shows every item of the P&L vs the monthly forecast / target and commentary on any items that are well out of spec, we have another report that shows each line of the P&L vs this month last year with commentary, revenue trends across various categories (kegs, pack, merch etc), Cost of Goods Sold trended over time, staff wages against target and on a trend line over time, wages broken down by division, overhead trends over time benchmarked against other publicly-available brewery data, cash flow forecast and statement with commentary and forecast P&L going forward 12 months.
Reading through that list it looks a bit extreme but I read all of these reports and regularly make decisions based on what’s in them. For some, like the sales report, we’ll have a team meeting to sit around and go through the results. For others, they are just for me and for the various teams to see where they are at and to stay on track.
4. Funding is Critical
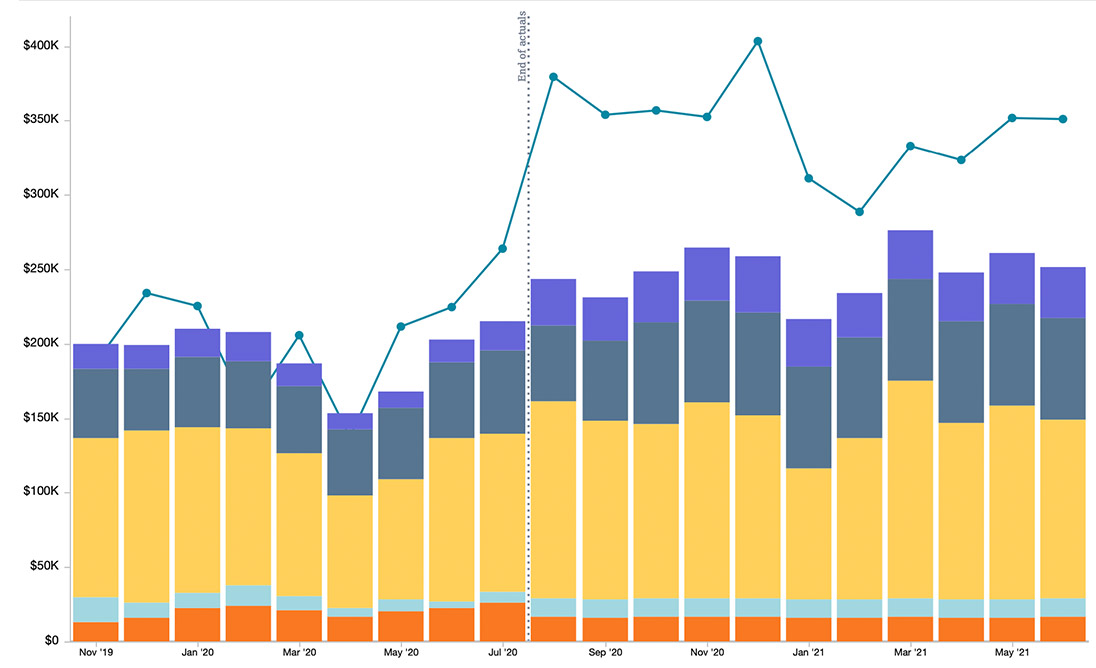
Running a brewery business is about as hard as you can get on cash flow. Virtually all expenses are paid for well in advance and almost none of the product is paid for when it’s taken. On top of that, if your goal is to expand beyond a small taproom, you have the extra challenge of navigating your way through the brewery valley of death to reach a scale where you can once again become profitable.
Every brewery business is different and our experience may not be the same as others. That said, I am certain that most breweries struggle with the task of building up distribution to achieve a reasonable level of scale. For us, our funding requirements were relatively small when we had a small local brewery and taproom. But once we started wholesaling, particularly packaged beer, things changed. Once we decided to build a second, much bigger brewery, things changed a lot more!
We’ve learned over many years and many different funding options that you can never have too much funding. The difficulty however is if you are giving up equity for funding, your valuation is going to be quite low at the start and you will have to give up a lot of equity for a small amount of money. If you give up too much, you’ll lose majority ownership and control. We gave up a lot of equity in our very first round to open Black Hops HQ and we’ve done many rounds since, each time giving up more and more equity.
Here’s a list of all the different funding rounds or finance options we’ve used at Black Hops. This isn’t financial advice, I’m sure there are better ways to go about this, this is just what we did:
- Founder investment – Originally the founders put money in to kick things off.
- Founder loans – There have been times the founders have loaned small amounts of money to the business, especially early on.
- Deferred wages – The founders have at times deferred their wages during difficult cashflow times.
- Reward-based crowdfunding – We completed a reward-based crowdfunding campaign where we gave up beer and merch in return for funds to help us open the original HQ brewery.
- Equity investment rounds – We have done 9 private equity investment rounds where we’ve given up equity to a total of 50 investors in return for funds for expansion. None of this has been to institutional investors, it’s all been friends and family / locals / customers etc.
- Equipment finance – We have a debt equipment finance facility with a major bank which helped towards funding the expansion to our second site, Black Hops II.
- Equity Crowdfunding – We undertook an Equity Crowdfunding round where we raised $400,000 among 500+ investors.
- Pre-selling – We’ve done a bit of pre-selling for things like beer releases and merch so we get paid up front as opposed to after the sale.
- Equipment leasing – We have lease arrangements for some of our equipment like our original canning line and delivery and sales rep vehicles.
- Invoice finance – We have an invoice finance facility from a major bank that lets us borrow money against incoming invoice payments to help with cash flow.
- Convertible Notes – We have one convertible note with a group of investors which is a slightly different finance option, somewhat of a combination between debt and equity.
I really have no idea how other breweries fund their expansion through the valley of death and beyond. I suspect most of the time it’s a few big institutional investors (which we’ve avoided), and if they are lucky, a decent amount of bank debt.
For us, we wanted to avoid big institutional investors, we didn’t really know any super high net worth individuals and we were never approved by banks until very recently.
5. Product Quality is Everything
All this talk of marketing, finance, reporting etc you’d be forgiven for thinking that breweries don’t even make beer. But the quality of the product cannot be ignored, it’s still for us by far the most important part of what we do.
The only reason people buy our beer, and at times line up for it, is because they know it’s going to be good. The sexy labels and studio photography helps hype up the release, but if the product is not good that will get old very quickly.
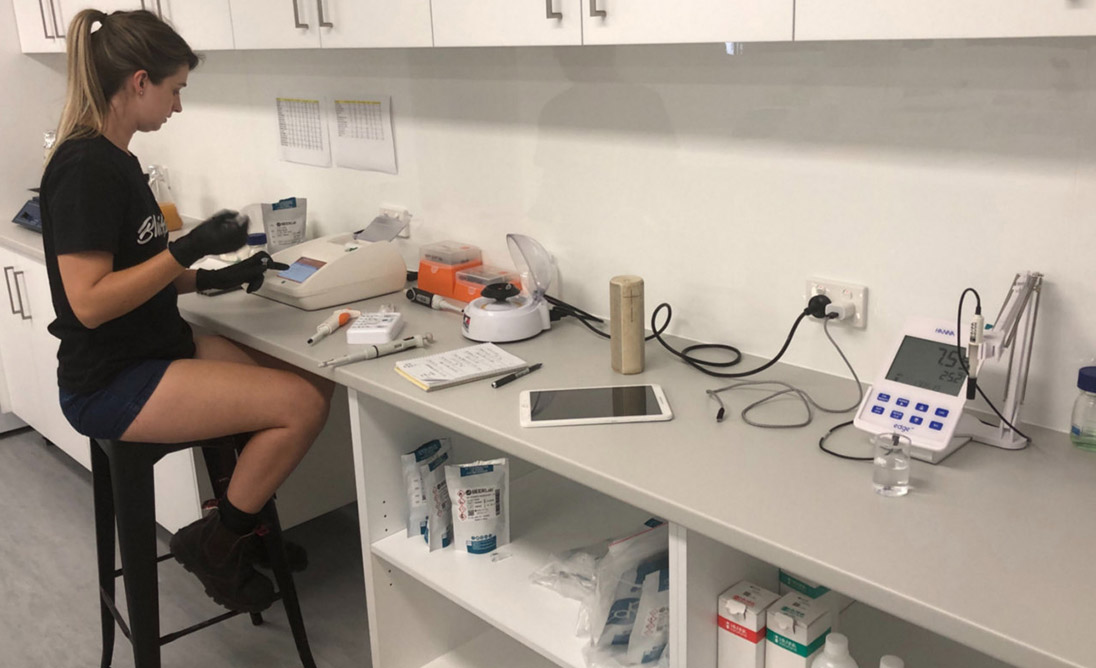
Making our small batch beers delicious is one thing, but ensuring the quality of 15,000L batches over and over again is something else. Quality is a cultural change and a big expense we’ve had to invest heavily in. We worked with a consultant on a quality plan, we employed a full time quality manager and we built an in-house lab filled with over $100,000 worth of testing equipment for testing a whole range of things across all of our beers. We have been through a product recall before and it’s not fun, and we’ve had to dump batches before and that’s not fun either.
Here are some of the things we do to aim to keep our product as high quality as possible:
- A comprehensive quality plan that is included in inductions and brewery processes.
- A full time quality manager who oversees all quality issues and all testing across all batches at various stages.
- A sensory program for beer releases and for general staff education. Sensory for beer releases assesses a beer against true to brand guidelines on a blind test and beers must pass sensory before being ‘released’.
- A brew at home program where staff can judge entries and learn about faults and flavours.
- Quality specs that beers must hit and a system that sits behind the production process that picks up if beers are ever out of spec.
- An in-house lab filled with expensive equipment for conducting a whole range of tests to test beer at various stages and record whether they are inside or outside control guidelines. These include water tests, PH and gravity, ABV, VDK, temperature, carbonation as well as microbiological tests for things like Lactobacillus and other living organisms.
- A recall plan and staff knowledge of how to handle product recalls.
- A quality inbox and issue system and process for dealing with quality complaints from customers.
- A weekly production and quality meeting where quality issues are raised and discussed.
That is a small list of what we do and it’s a constantly evolving program which is necessary to ensure the ongoing quality of beer.
Here is a post with some more information around setting up our in-house Brewery Quality lab.
Continue to part 2
You can read part 2 of this post here or check out the ebook which you can grab here.
